Data About Our Students
Click on images for a larger versions of the charts.
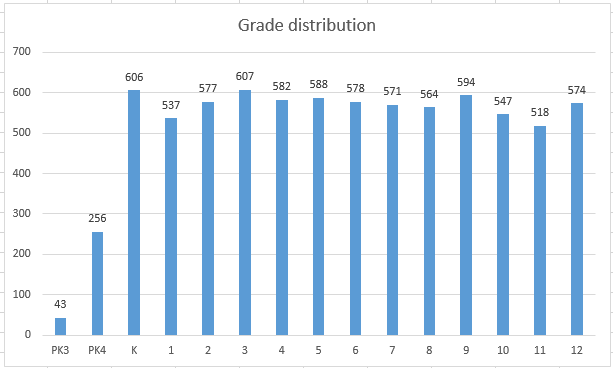
Grade Distribution:
How many students are in each grade
Special Education Programs:
How many students fall into the various categories of Student Support Services?
At the time this chart was made, 737 received services. This is about 9.5% of the overall student population.
IEP Status
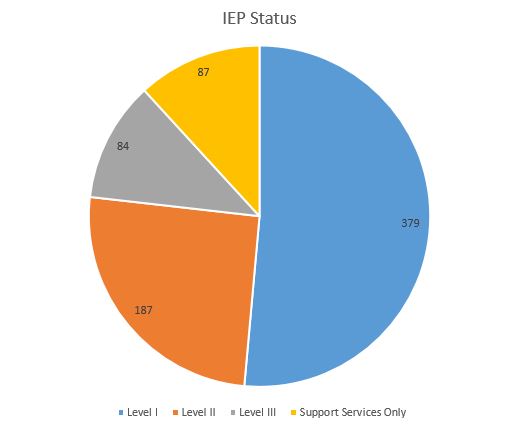
Linn-Mar provides a continuum of services and supports to students in Special Education.
Level 1 referrals to minimal services and supports up to Level 3 needing intensive services and supports.
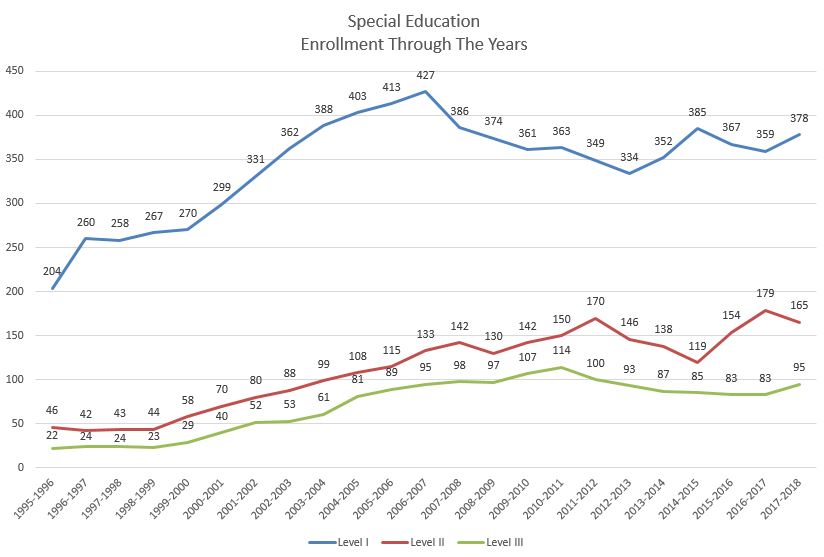
Enrollment trends through the years
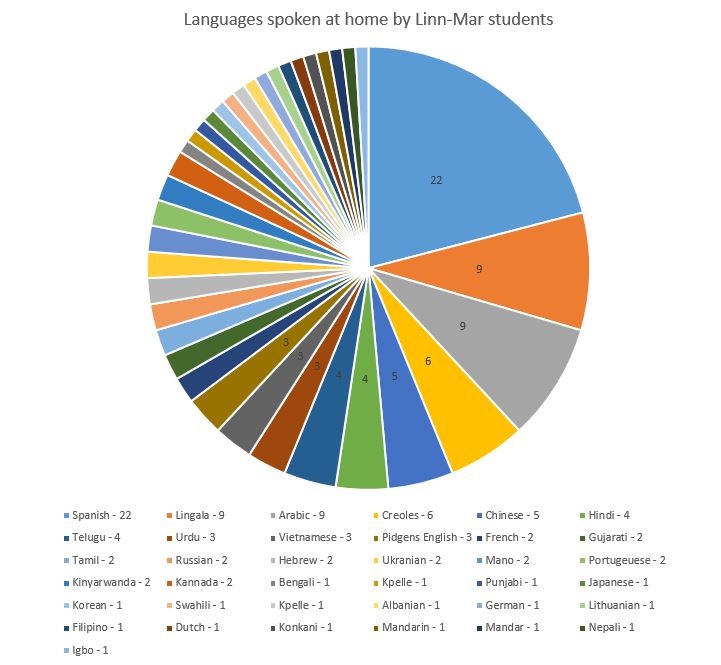
English Language Learners (ELL):
As of December 2017, there were 255 students with a primary language other than English. This is roughly 3% of the student population.
Breakdown of the various languages students speak at home
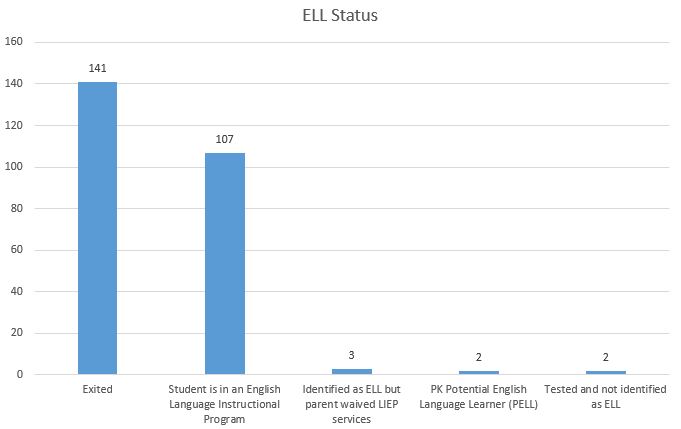
As of December 2017, there were 255 students with some sort of ELL status. This is roughly 3% of the student population.
Breakdown of students receiving ELL instruction
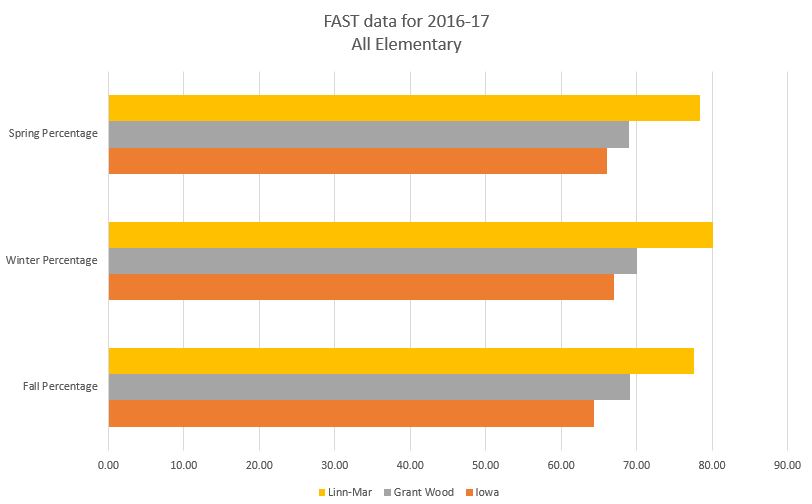
Testing Data:
FAST Testing
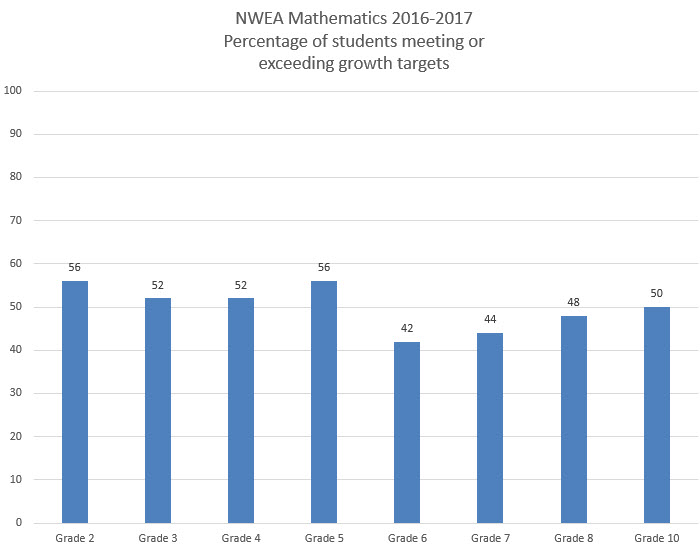
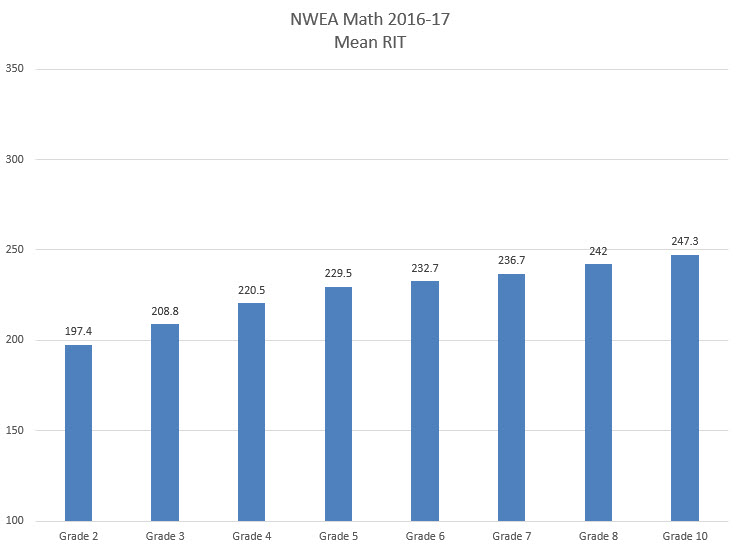
NWEA Mathematics 2016-17
Percentage of students meeting or exceeding growth targets
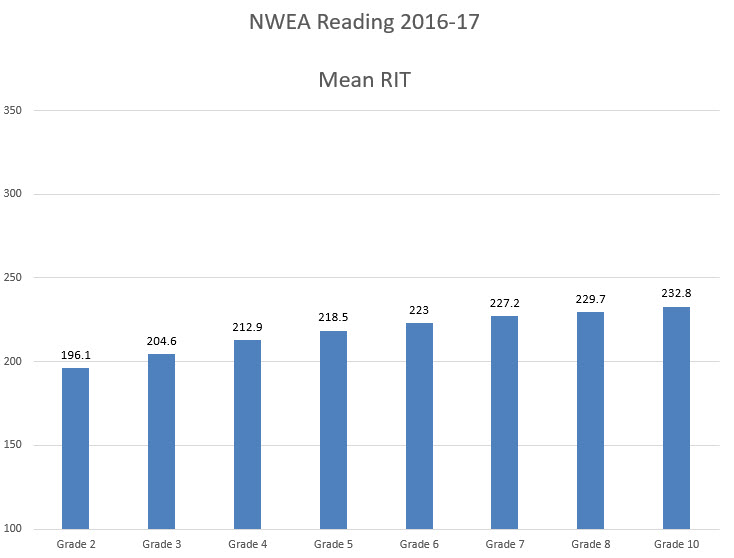
Mean RIT
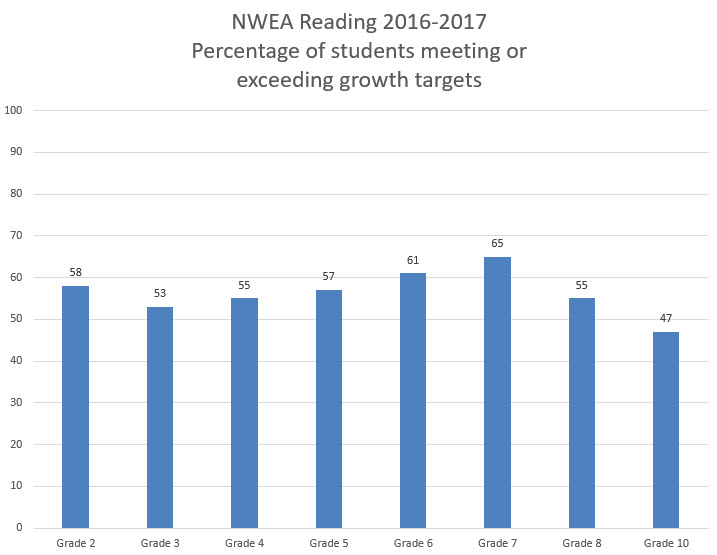
NWEA Reading 2016-17
Percentage of students meeting or exceeding growth targets
Mean RIT